In the world of data analysis, Excel pivot tables are an incredibly powerful tool for summarizing and analyzing large datasets. While pivot tables are often associated with numerical data, they can also be used with text values. In this article, we'll explore the world of pivot tables with text values and provide you with the skills and knowledge you need to master this essential data analysis technique.
The Power of Pivot Tables
Before we dive into the specifics of pivot tables with text values, it's essential to understand the basics of pivot tables. A pivot table is a dynamic summary of a large dataset that allows you to rotate, aggregate, and analyze your data from different perspectives. Pivot tables are particularly useful when working with large datasets, as they enable you to quickly and easily summarize and analyze your data without having to manually create formulas or charts.
The Challenge of Text Values
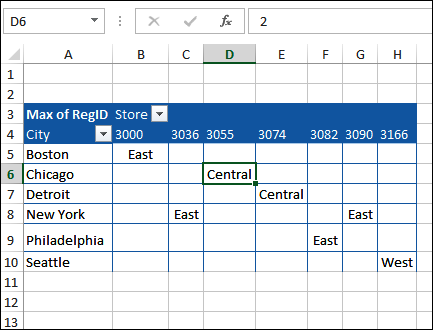
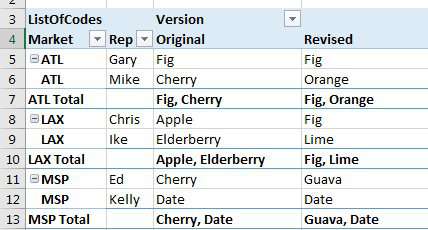
While pivot tables are incredibly powerful, they can be a bit more challenging to use with text values. This is because text values are not numerical, and therefore cannot be summed or averaged in the same way that numerical values can. However, this does not mean that pivot tables are not useful with text values. In fact, pivot tables can be used to summarize and analyze text data in a variety of ways, including counting the number of occurrences of specific text values, grouping text values into categories, and more.
Creating a Pivot Table with Text Values
To create a pivot table with text values, you'll need to follow these steps:
- Select the cell range that contains your data.
- Go to the "Insert" tab in the ribbon.
- Click on the "PivotTable" button.
- Select a cell to place the pivot table.
- Choose the fields you want to include in the pivot table.

Using the "Value Field Settings"
One of the most important things to understand when working with pivot tables and text values is the "Value Field Settings" dialog box. This dialog box allows you to customize how your text values are displayed and summarized in the pivot table.
To access the "Value Field Settings" dialog box, follow these steps:
- Select the field that contains your text values.
- Right-click on the field and select "Value Field Settings".
- In the "Value Field Settings" dialog box, you can choose from a variety of options, including "Count", "Distinct Count", and more.

Counting Text Values
One of the most common ways to summarize text values in a pivot table is to count the number of occurrences of specific text values. To do this, follow these steps:
- Select the field that contains your text values.
- Right-click on the field and select "Value Field Settings".
- In the "Value Field Settings" dialog box, select "Count" as the value field.
- Click "OK" to apply the changes.

Grouping Text Values
Another way to summarize text values in a pivot table is to group them into categories. To do this, follow these steps:
- Select the field that contains your text values.
- Right-click on the field and select "Group".
- In the "Group" dialog box, select the categories you want to use to group your text values.
- Click "OK" to apply the changes.

Pivot Table with Text Values Best Practices
Here are some best practices to keep in mind when working with pivot tables and text values:
- Use the "Value Field Settings" dialog box to customize how your text values are displayed and summarized.
- Use the "Count" value field to count the number of occurrences of specific text values.
- Use the "Group" feature to group text values into categories.
- Use the "Distinct Count" value field to count the number of unique text values.
- Avoid using the "Sum" value field with text values, as it can produce incorrect results.
Conclusion
Mastering pivot tables with text values is an essential skill for any data analyst. By following the steps and best practices outlined in this article, you'll be able to summarize and analyze your text data with ease. Whether you're working with customer feedback, product reviews, or any other type of text data, pivot tables can help you unlock insights and make data-driven decisions.
Gallery of Pivot Tables with Text Values


FAQs
What is a pivot table?
+A pivot table is a dynamic summary of a large dataset that allows you to rotate, aggregate, and analyze your data from different perspectives.
Can I use pivot tables with text values?
+How do I count text values in a pivot table?
+To count text values in a pivot table, select the field that contains your text values, right-click on the field and select "Value Field Settings", and then select "Count" as the value field.


