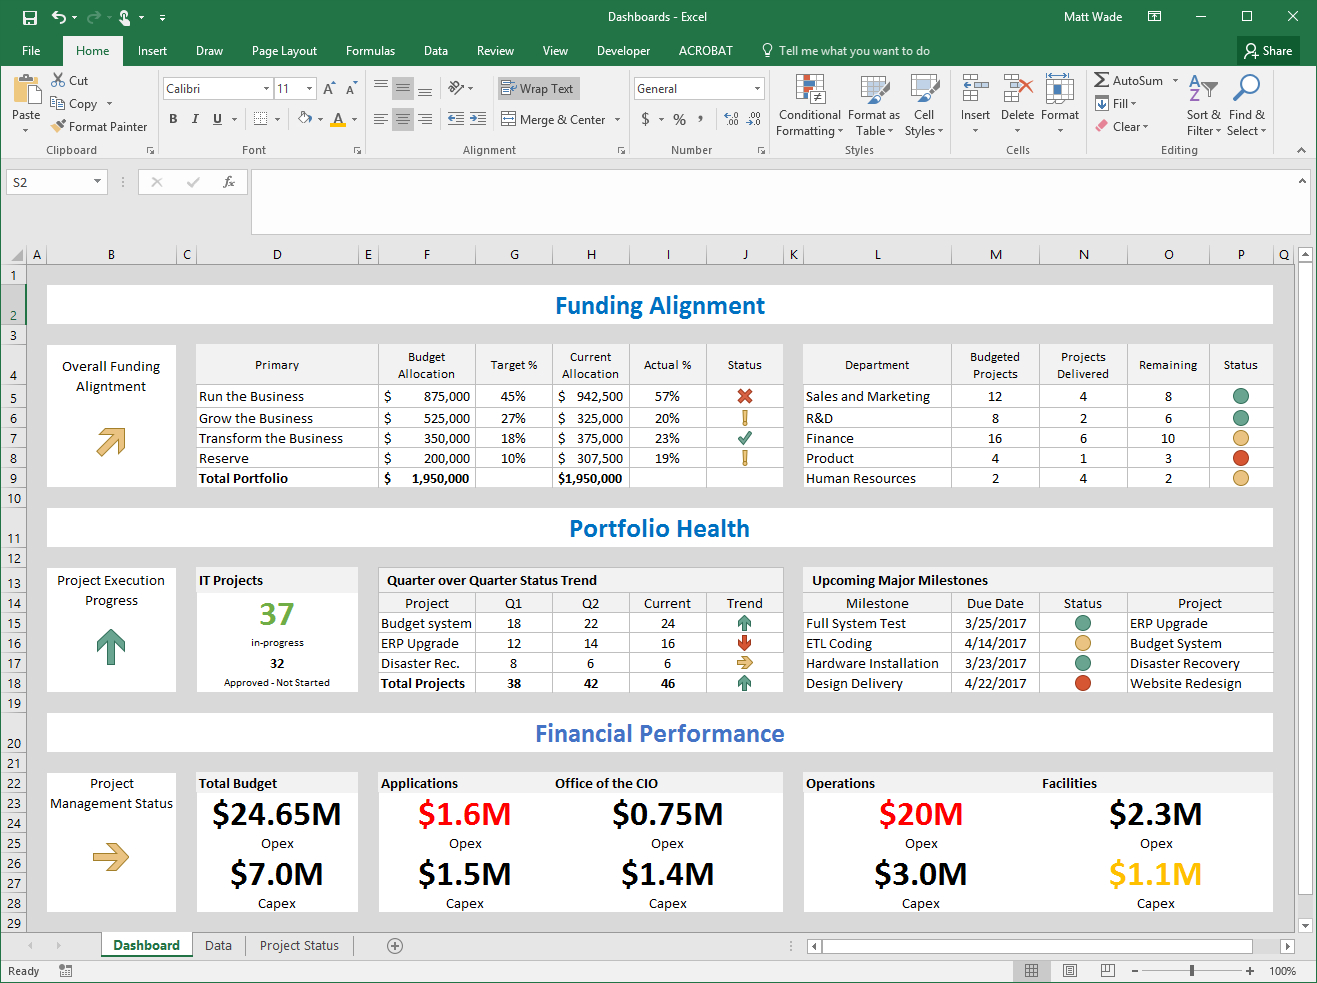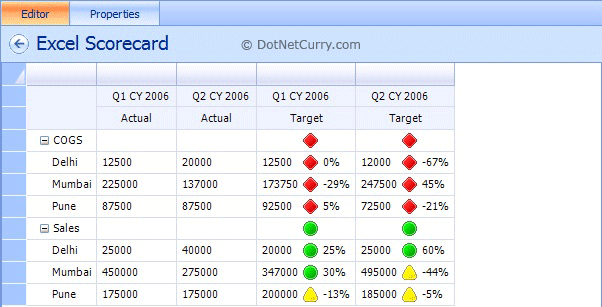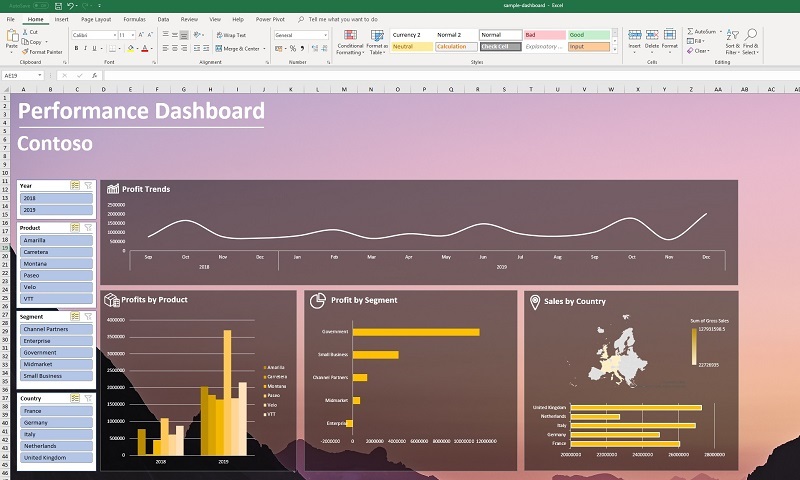
As organizations increasingly rely on data-driven decision-making, the demand for intuitive and interactive dashboards has grown exponentially. SharePoint, a popular collaboration platform, offers a robust solution for creating dashboards that cater to various business needs. However, creating a dashboard from scratch can be a daunting task, especially for those without extensive technical expertise. Fortunately, with Excel, you can create a SharePoint dashboard in minutes. In this article, we will explore the process of creating a SharePoint dashboard from Excel, highlighting its benefits, steps, and best practices.
Creating a SharePoint Dashboard: Why Excel?
Excel is a widely used spreadsheet application that offers a user-friendly interface for data analysis and visualization. Its extensive range of formulas, functions, and tools enable users to create interactive dashboards that can be easily shared with others. When combined with SharePoint, Excel becomes an even more powerful tool for creating dashboards that can be accessed by multiple stakeholders.
Benefits of Creating a SharePoint Dashboard from Excel
Before we dive into the steps, let's explore the benefits of creating a SharePoint dashboard from Excel:
- Easy to Use: Excel is a familiar tool for many users, making it easier to create dashboards without requiring extensive technical knowledge.
- Faster Deployment: With Excel, you can create a dashboard in minutes, reducing the time and effort required to deploy a dashboard.
- Customizable: Excel offers a wide range of customization options, enabling users to create dashboards that meet specific business needs.
- Collaborative: SharePoint's collaborative features enable multiple stakeholders to access and interact with the dashboard, promoting data-driven decision-making.
Steps to Create a SharePoint Dashboard from Excel
Now that we've explored the benefits, let's walk through the steps to create a SharePoint dashboard from Excel:
- Prepare Your Data: The first step is to prepare your data in Excel. Ensure that your data is organized, clean, and in a format that can be easily visualized.
- Create a Table: Create a table in Excel to structure your data. This will make it easier to create visualizations and interact with your data.
- Add Visualizations: Use Excel's visualization tools to create charts, tables, and other interactive elements that will be used in your dashboard.
- Publish to SharePoint: Publish your Excel file to SharePoint, either by uploading it to a document library or by using the "Publish to SharePoint" feature in Excel.
- Create a Dashboard: Create a new dashboard in SharePoint and add your Excel file as a web part.
- Configure Interactivity: Configure the interactivity features in your dashboard, such as filtering, sorting, and drill-down capabilities.

Best Practices for Creating a SharePoint Dashboard from Excel
While creating a SharePoint dashboard from Excel is relatively straightforward, there are several best practices to keep in mind:
- Keep it Simple: Avoid cluttering your dashboard with too many visualizations or complex interactions.
- Use Clear Labels: Use clear and concise labels for your visualizations and interactions.
- Test and Refine: Test your dashboard with various stakeholders and refine it based on feedback.
Common Pitfalls to Avoid
While creating a SharePoint dashboard from Excel can be a straightforward process, there are several common pitfalls to avoid:
- Insufficient Testing: Failing to test your dashboard with various stakeholders can lead to usability issues and a lack of adoption.
- Over-Complexity: Creating a dashboard that is too complex or cluttered can lead to user confusion and frustration.
- Lack of Governance: Failing to establish governance policies for your dashboard can lead to data inconsistencies and security issues.


In conclusion, creating a SharePoint dashboard from Excel is a straightforward process that can be completed in minutes. By following the steps outlined in this article and adhering to best practices, you can create a dashboard that meets your business needs and promotes data-driven decision-making.
What is the benefit of creating a SharePoint dashboard from Excel?
+The benefits of creating a SharePoint dashboard from Excel include ease of use, faster deployment, customization, and collaboration. Excel is a familiar tool for many users, making it easier to create dashboards without requiring extensive technical knowledge.
How do I create a SharePoint dashboard from Excel?
+To create a SharePoint dashboard from Excel, prepare your data, create a table, add visualizations, publish to SharePoint, create a dashboard, and configure interactivity. You can also use the "Publish to SharePoint" feature in Excel to simplify the process.
What are some best practices for creating a SharePoint dashboard from Excel?
+Best practices for creating a SharePoint dashboard from Excel include keeping it simple, using clear labels, and testing and refining your dashboard with various stakeholders. Avoid cluttering your dashboard with too many visualizations or complex interactions.

