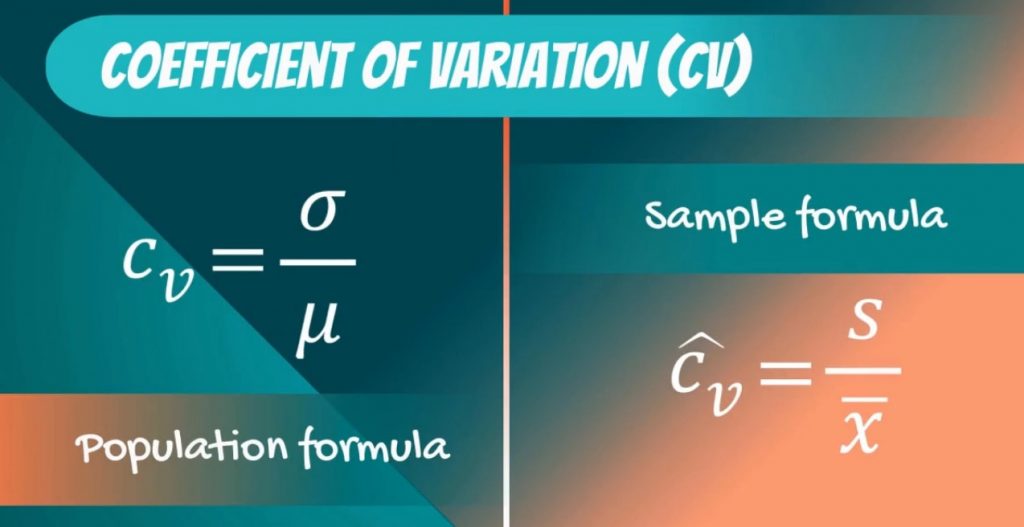
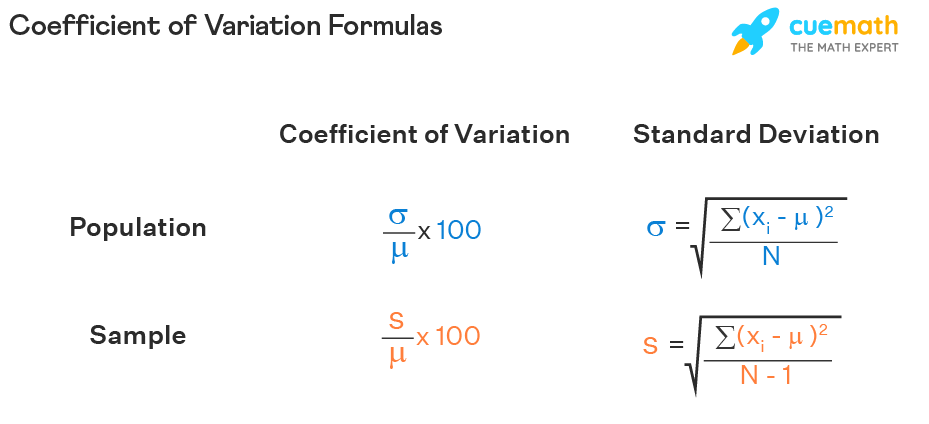
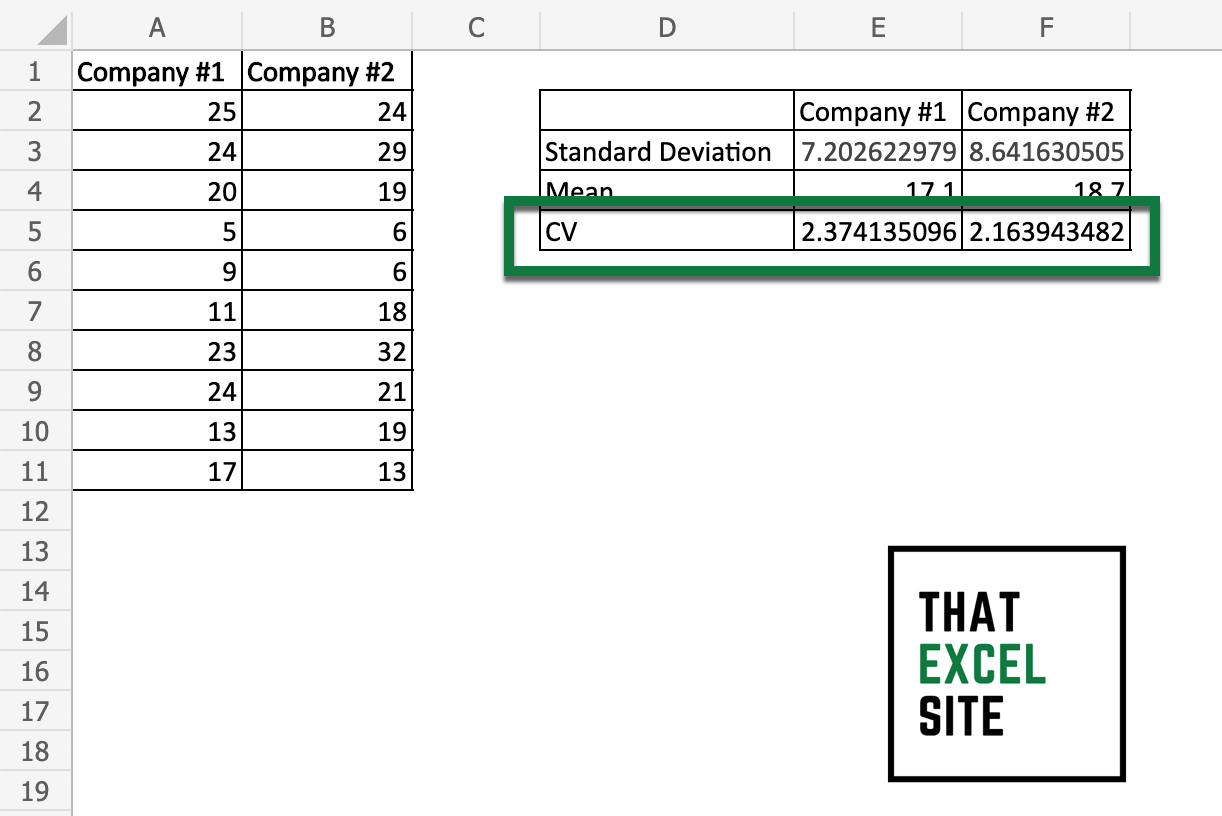
When it comes to analyzing data in Excel, one statistical measure that provides valuable insights is the coefficient of variation (CV). The coefficient of variation is a standardized measure of dispersion of a probability distribution or frequency distribution. It is defined as the ratio of the standard deviation to the mean, and it is often expressed as a percentage. In this article, we will explore five ways to calculate the coefficient of variation in Excel, highlighting the steps involved in each method and providing practical examples.
Why is Coefficient of Variation Important?
Before we dive into the methods of calculating the coefficient of variation, let's quickly discuss why this measure is important. The coefficient of variation is useful in comparing the variability of two or more datasets that have different units or scales. It allows you to understand the dispersion of a dataset relative to its mean, providing a standardized way to compare variability across different datasets.
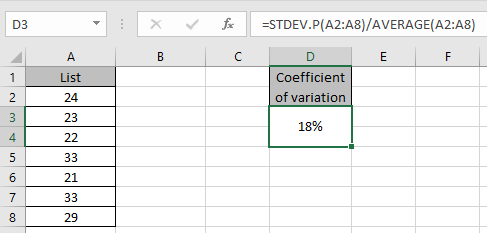
Method 1: Using the STDEV.P and AVERAGE Functions
One straightforward way to calculate the coefficient of variation in Excel is by using the STDEV.P and AVERAGE functions.
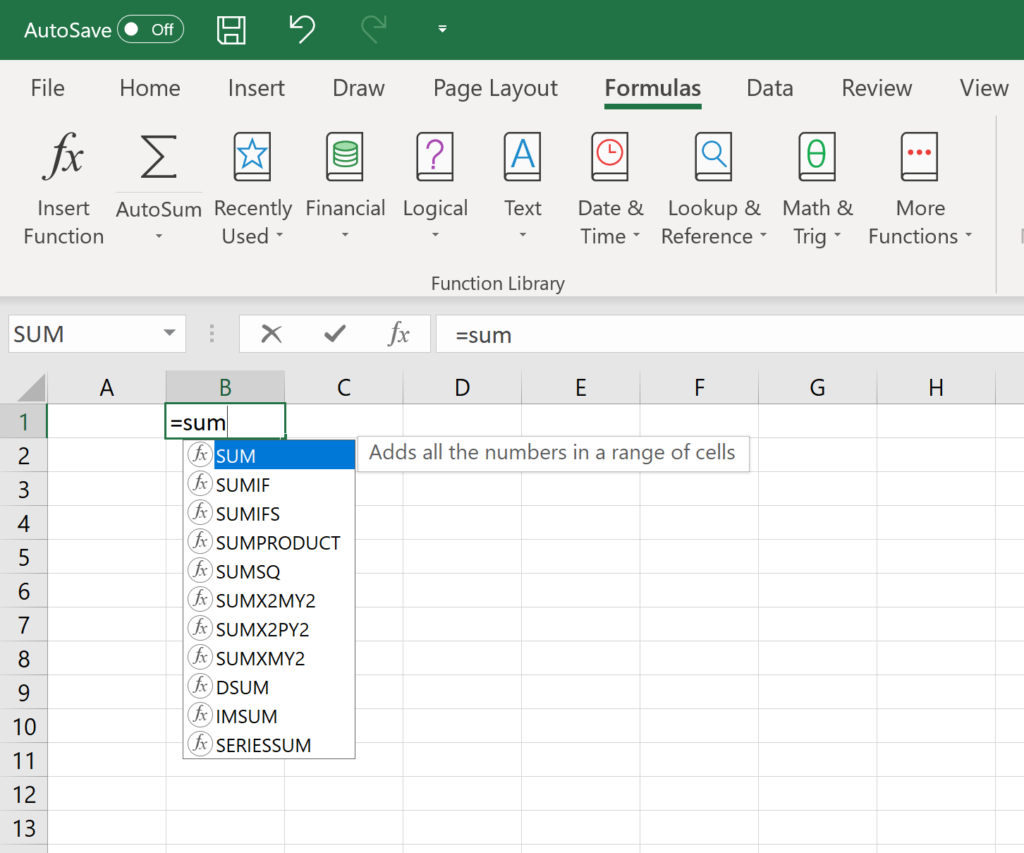
- Enter your data in a column.
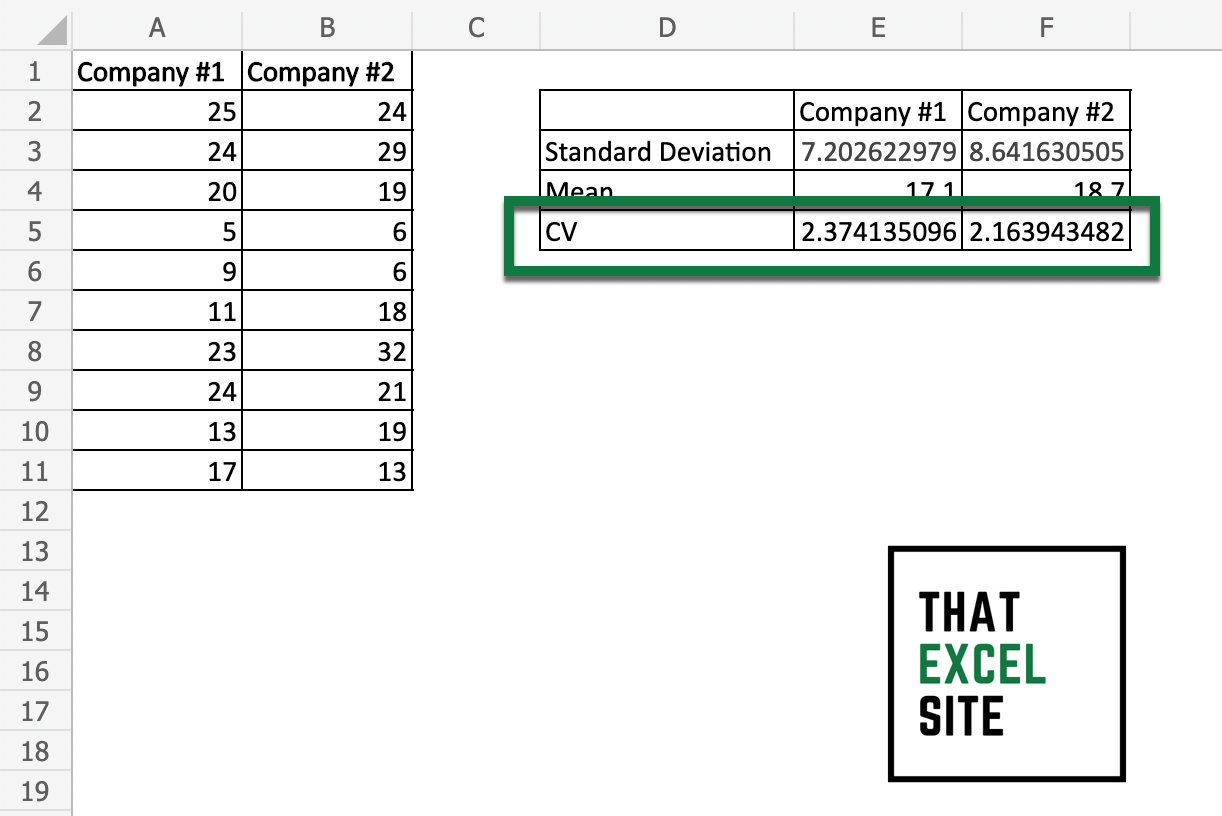
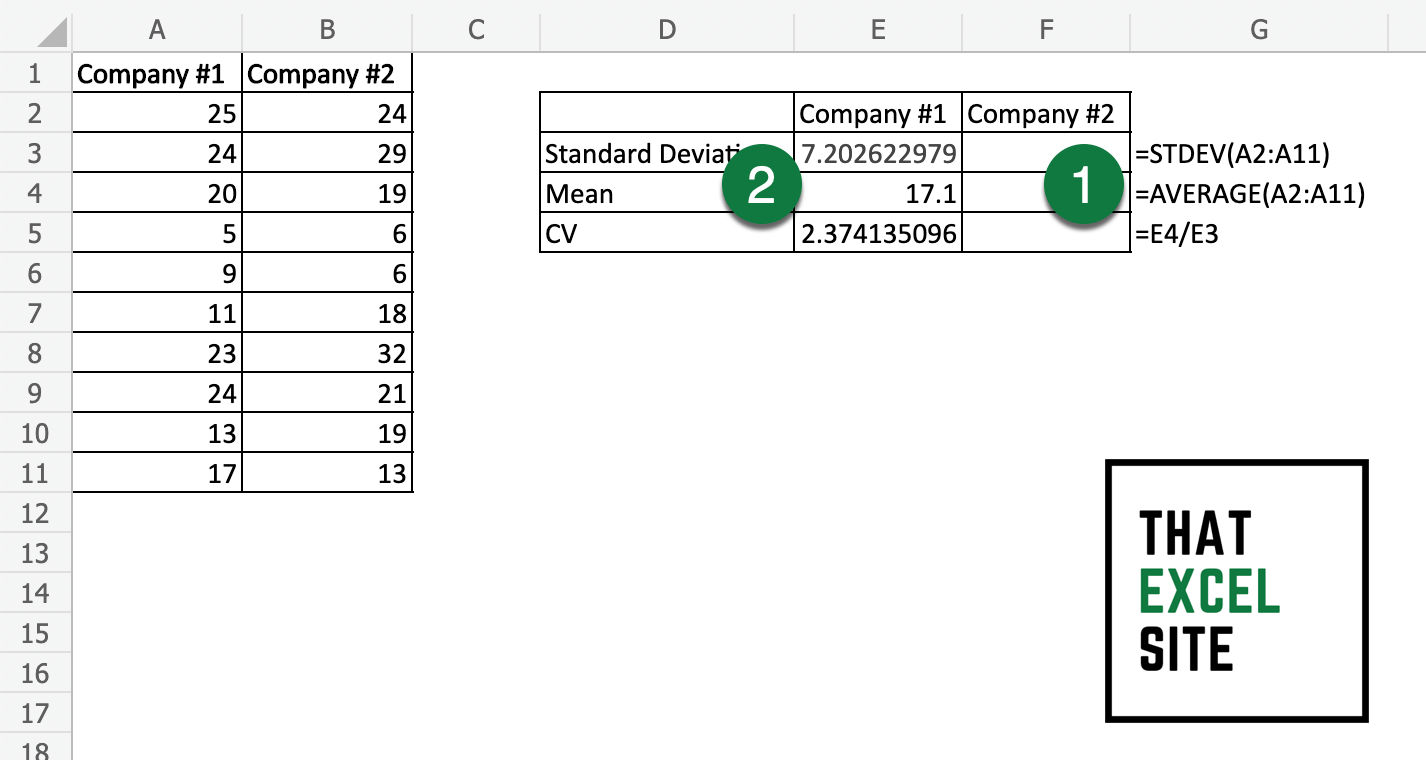
- Calculate the mean using the AVERAGE function. For example, if your data is in column A, the formula would be
=AVERAGE(A1:A10). - Calculate the standard deviation using the STDEV.P function. For example,
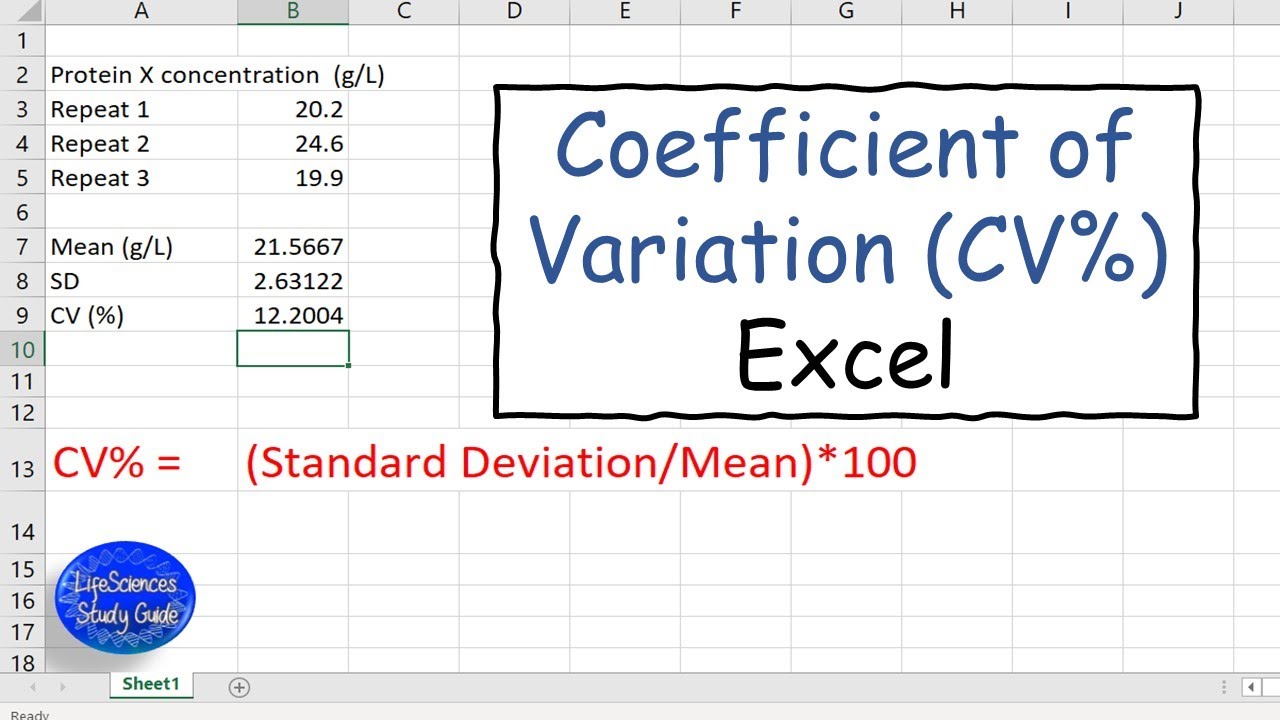
=STDEV.P(A1:A10). - Calculate the coefficient of variation by dividing the standard deviation by the mean, then multiplying by 100 to express it as a percentage. The formula would be
=(STDEV.P(A1:A10)/AVERAGE(A1:A10))*100.
Method 2: Using the VAR.P and AVERAGE Functions
Another method involves using the VAR.P function to calculate the variance and then taking the square root to find the standard deviation.
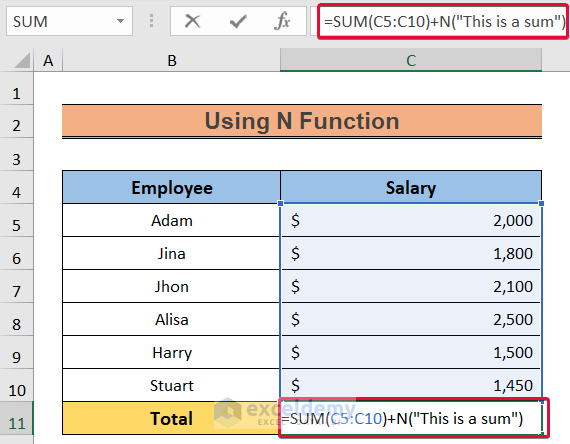
- Calculate the variance using the VAR.P function:
=VAR.P(A1:A10). - Calculate the standard deviation by taking the square root of the variance:
=SQRT(VAR.P(A1:A10)). - Proceed as in Method 1 to calculate the coefficient of variation.
Method 3: Using the STDEV.S and AVERAGE Functions
For sample data, you might want to use the STDEV.S function to calculate the sample standard deviation.
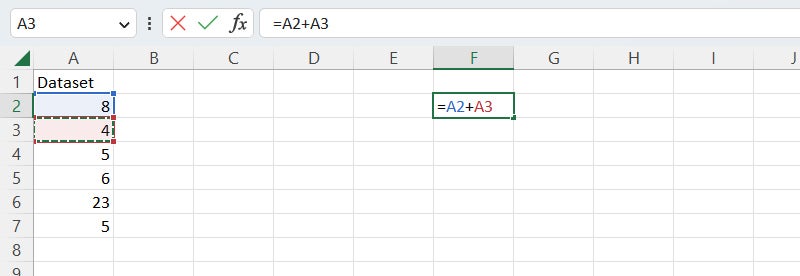
- Calculate the mean as in Method 1.
- Calculate the sample standard deviation using the STDEV.S function:
=STDEV.S(A1:A10). - Calculate the coefficient of variation as in Method 1.
Method 4: Using the VAR.S and AVERAGE Functions
Similar to Method 2, but for sample data, you can use the VAR.S function to calculate the sample variance.
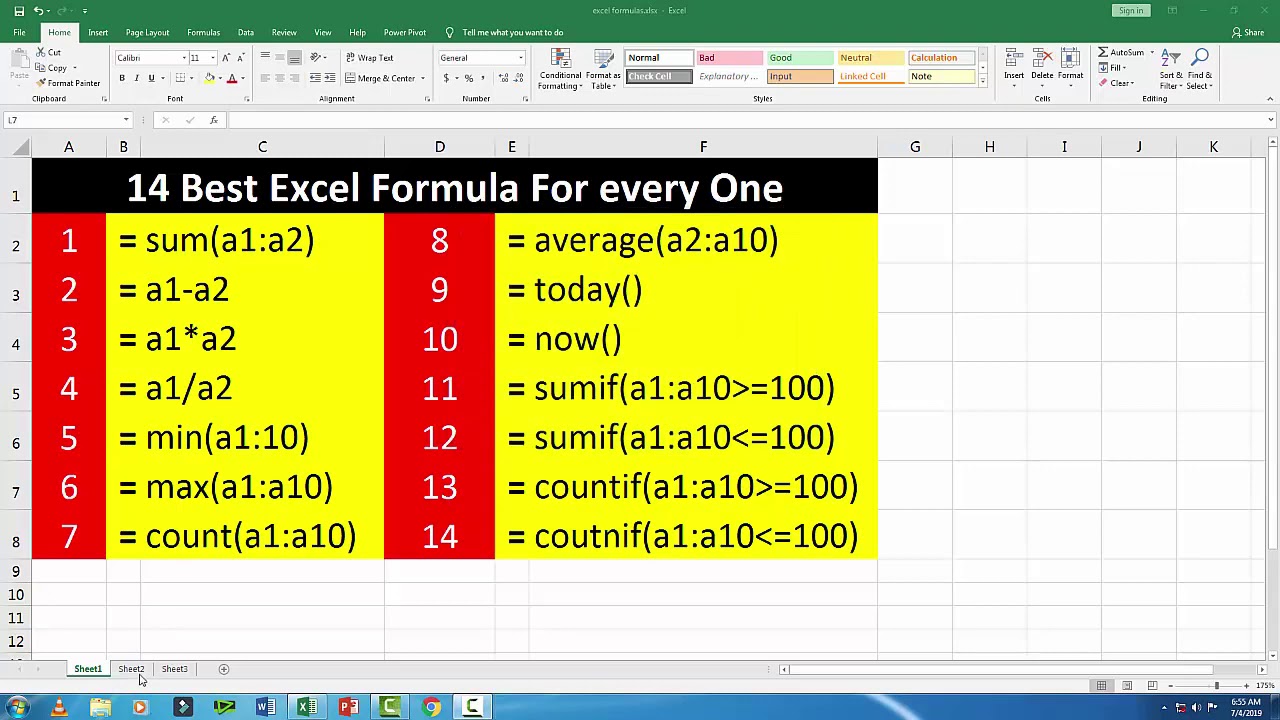
- Calculate the sample variance using the VAR.S function:
=VAR.S(A1:A10). - Calculate the sample standard deviation by taking the square root of the sample variance:
=SQRT(VAR.S(A1:A10)). - Proceed as in Method 1 to calculate the coefficient of variation.
Method 5: Using the Coefficient of Variation Formula Directly
For a more direct approach, you can use the formula for the coefficient of variation in a single cell.
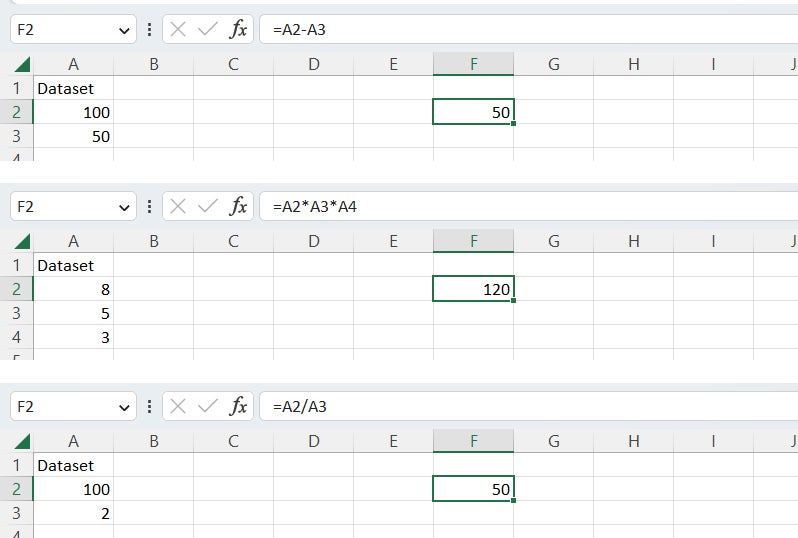
- Enter the formula
=(STDEV.P(A1:A10)/AVERAGE(A1:A10))*100directly in a cell to calculate the coefficient of variation.
Gallery of Coefficient of Variation Examples
FAQs
What is the difference between STDEV.P and STDEV.S in Excel?
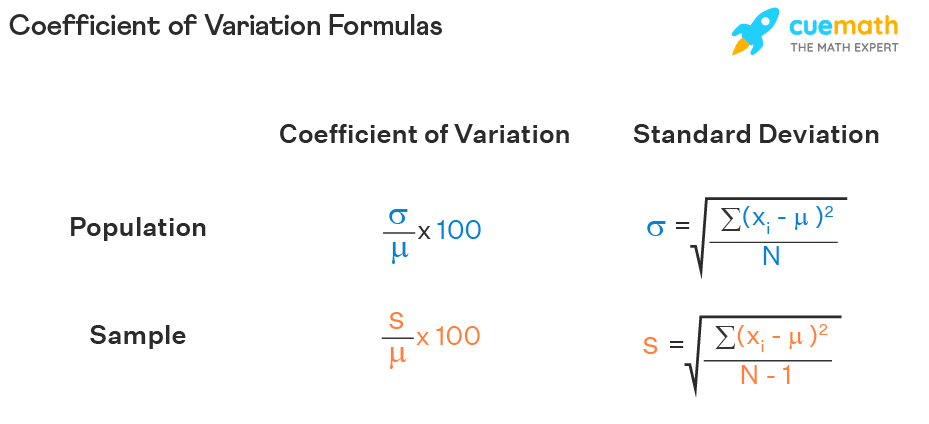
+STDEV.P calculates the population standard deviation, while STDEV.S calculates the sample standard deviation. Use STDEV.P when you have the entire population data, and use STDEV.S when you have a sample of the population.
How do I decide which method to use for calculating the coefficient of variation in Excel?
+Choose the method based on whether you are working with population data or sample data. Also, consider whether you want to calculate the standard deviation using the STDEV functions or derive it from the variance using the VAR functions.
Call to Action
In conclusion, calculating the coefficient of variation in Excel can be accomplished through various methods, each with its own approach to calculating the standard deviation and mean. By understanding these different methods, you can select the most appropriate one for your data analysis needs. Share this article with your peers who might benefit from learning about these methods, and feel free to ask any questions or provide feedback in the comments section below.

