Mastering Microsoft Excel can significantly enhance your productivity and data analysis capabilities. One of the fundamental concepts in data analysis is the 5 number summary, which provides a concise overview of a dataset. In this article, we will delve into the world of the 5 number summary, exploring its components, calculation methods, and practical applications in Excel.
What is a 5 Number Summary?
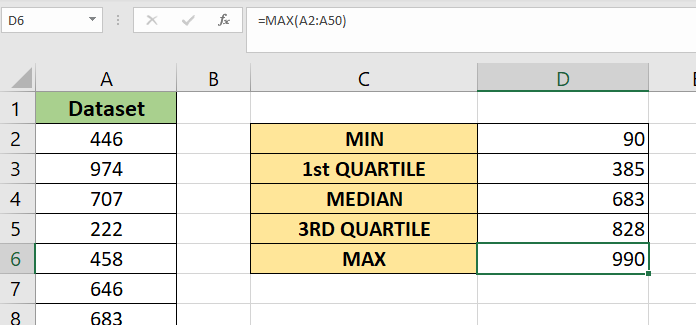
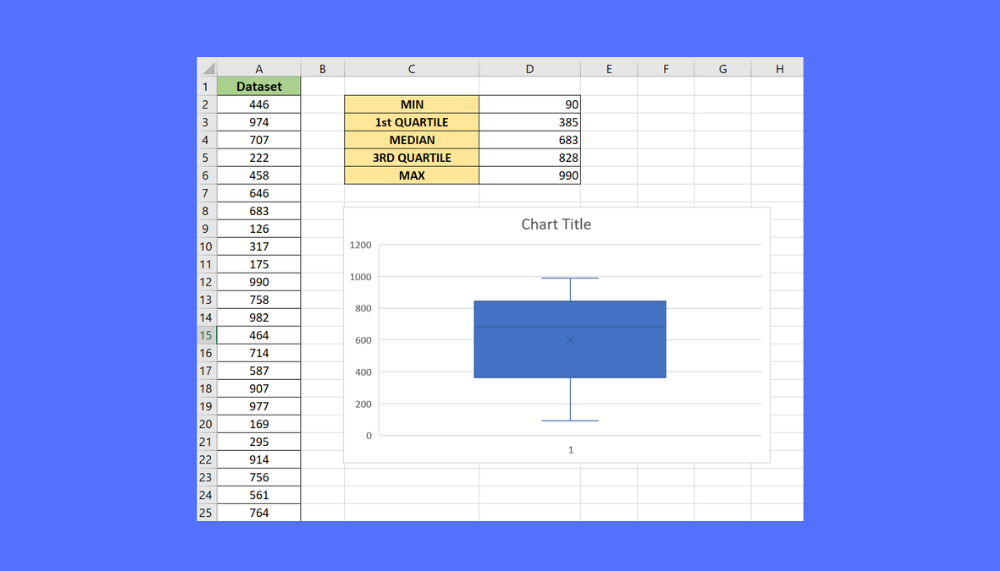
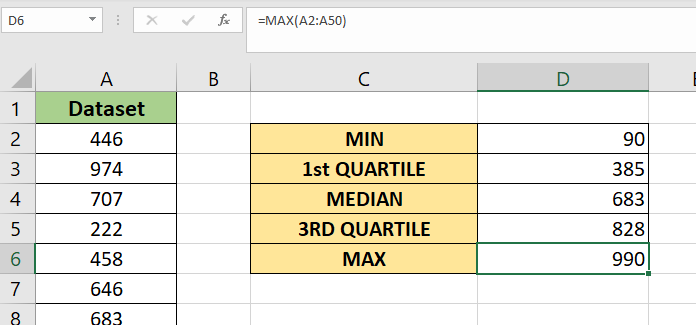
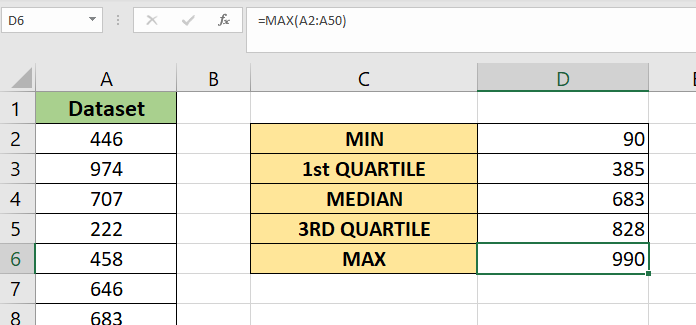
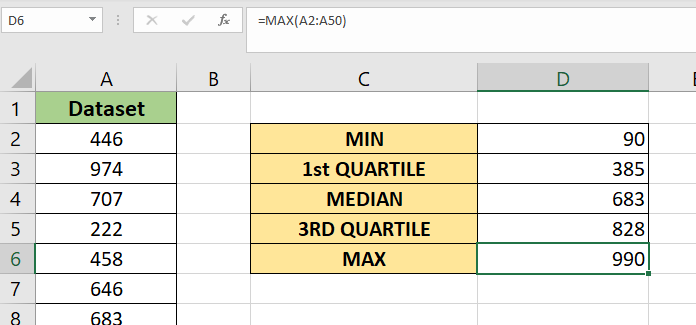
A 5 number summary, also known as a "five-number summary," is a statistical summary that provides a compact representation of a dataset. It consists of five key values: the minimum value, the first quartile (Q1), the median (second quartile or Q2), the third quartile (Q3), and the maximum value. These five numbers give you a sense of the dataset's central tendency, dispersion, and shape.
Components of a 5 Number Summary
- Minimum Value: The smallest value in the dataset.
- First Quartile (Q1): The median of the lower half of the dataset. It is the value below which 25% of the data points fall.
- Median (Q2): The middle value of the dataset when it is sorted in ascending order. It is the value that separates the lower half from the upper half.
- Third Quartile (Q3): The median of the upper half of the dataset. It is the value above which 25% of the data points fall.
- Maximum Value: The largest value in the dataset.
How to Calculate a 5 Number Summary in Excel
There are several ways to calculate a 5 number summary in Excel, including using formulas, functions, and built-in tools.
Method 1: Using Formulas
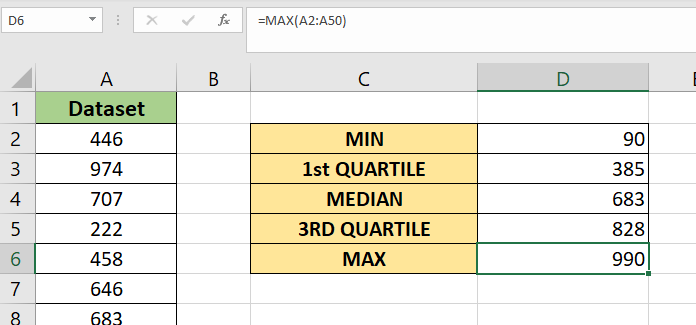
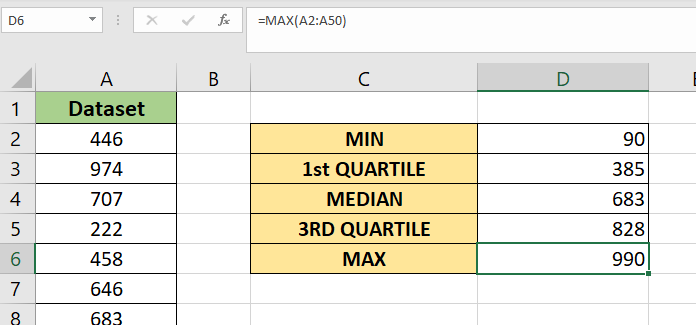
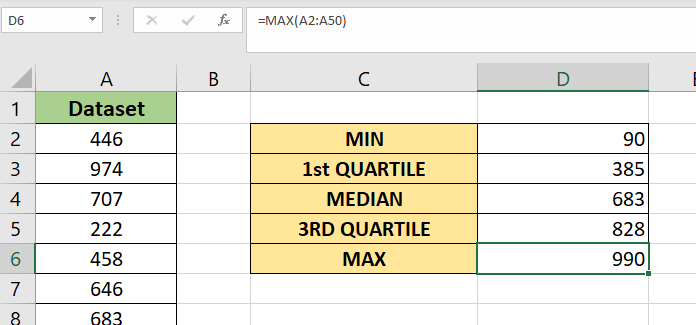
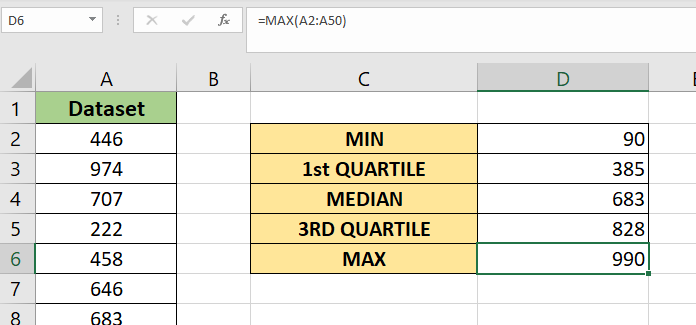
You can calculate the 5 number summary using the following formulas:
- Minimum Value:
MIN(range) - First Quartile (Q1):
QUARTILE(range, 1) - Median (Q2):
MEDIAN(range) - Third Quartile (Q3):
QUARTILE(range, 3) - Maximum Value:
MAX(range)
Method 2: Using the Analysis ToolPak
If you have the Analysis ToolPak add-in installed, you can use the "Descriptive Statistics" tool to calculate the 5 number summary.
- Go to the "Data" tab and click on "Data Analysis" in the "Analysis" group.
- Select "Descriptive Statistics" from the list of available tools.
- Choose the input range and select the "Summary statistics" option.
- Click "OK" to generate the 5 number summary.
Method 3: Using Excel Functions
You can also use the following Excel functions to calculate the 5 number summary:
MINIFSandMAXIFSfor minimum and maximum valuesQUARTILEfor first and third quartilesMEDIANfor median value
Practical Applications of 5 Number Summary in Excel
The 5 number summary has numerous practical applications in data analysis, including:
- Data exploration: It provides a quick overview of the dataset, helping you understand the distribution of values and identify potential outliers.
- Data visualization: You can use the 5 number summary to create box plots, histograms, and other visualizations to communicate insights to stakeholders.
- Statistical analysis: The 5 number summary is a fundamental component of many statistical tests and models, such as regression analysis and hypothesis testing.
Gallery of 5 Number Summary Examples
FAQs
What is the purpose of a 5 number summary?
+The 5 number summary provides a concise overview of a dataset, including its central tendency, dispersion, and shape.
How do I calculate the 5 number summary in Excel?
+You can calculate the 5 number summary using formulas, functions, or the Analysis ToolPak add-in.
What are some practical applications of the 5 number summary?
+The 5 number summary has numerous practical applications, including data exploration, data visualization, and statistical analysis.
By mastering the 5 number summary, you can unlock new insights into your data and make more informed decisions. Whether you're a data analyst, researcher, or business professional, the 5 number summary is an essential tool to have in your Excel toolkit.
