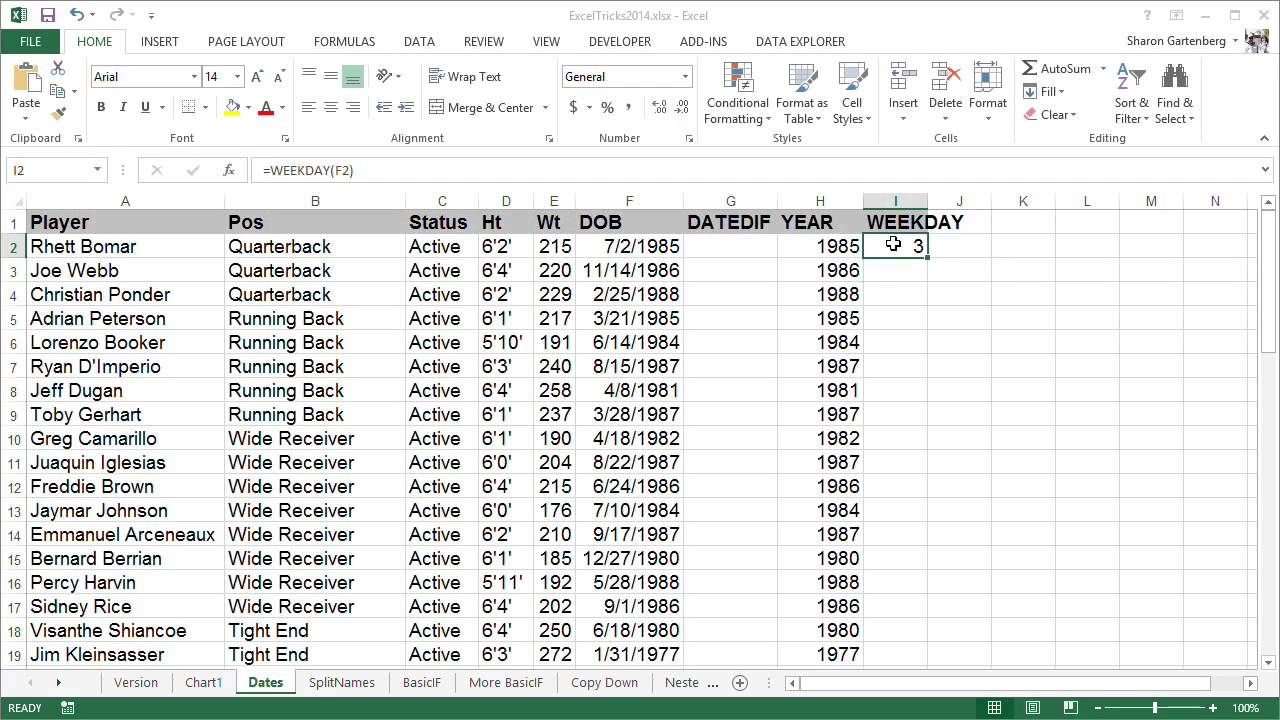
Excel is an incredibly powerful tool for data analysis and manipulation. With its extensive range of formulas, functions, and features, it can be used to perform complex data tasks with ease. However, mastering data manipulation in Excel requires practice, patience, and a deep understanding of its capabilities. In this article, we will explore seven ways to master data manipulation in Excel, from basic techniques to advanced methods.
Data manipulation is a critical aspect of data analysis, and it involves cleaning, transforming, and preparing data for analysis. Excel provides a wide range of tools and techniques to perform data manipulation, including formulas, functions, pivot tables, and more. By mastering these techniques, you can unlock the full potential of Excel and take your data analysis skills to the next level.

1. Basic Arithmetic Operations
The first step to mastering data manipulation in Excel is to understand basic arithmetic operations. Excel provides a wide range of arithmetic operators, including addition (+), subtraction (-), multiplication (*), and division (/). These operators can be used to perform simple calculations, such as summing a range of numbers or calculating the average of a set of values.
For example, suppose we have a set of numbers in cells A1:A10, and we want to calculate the sum of these numbers. We can use the SUM function, which is a built-in function in Excel that calculates the sum of a range of numbers. The formula would be =SUM(A1:A10).
2. Using Formulas and Functions
Formulas and functions are the building blocks of data manipulation in Excel. A formula is an equation that performs a calculation, while a function is a pre-built formula that performs a specific task. Excel provides a wide range of formulas and functions, including arithmetic, statistical, and financial functions.
For example, suppose we have a set of numbers in cells A1:A10, and we want to calculate the average of these numbers. We can use the AVERAGE function, which is a built-in function in Excel that calculates the average of a range of numbers. The formula would be =AVERAGE(A1:A10).
3. Working with Pivot Tables
Pivot tables are a powerful tool in Excel that allows you to summarize and analyze large datasets. A pivot table is a table that can be rotated to show different views of the data. Pivot tables are particularly useful for analyzing large datasets, as they allow you to easily summarize and filter the data.
For example, suppose we have a dataset that contains sales data for a company, including the date, region, and amount sold. We can use a pivot table to summarize the data by region and calculate the total amount sold for each region.
4. Using Index and Match Functions
The INDEX and MATCH functions are two of the most powerful functions in Excel. The INDEX function returns a value at a specified position in a range of cells, while the MATCH function returns the relative position of a value within a range of cells. These functions can be used together to perform complex data manipulation tasks.
For example, suppose we have a dataset that contains customer information, including the customer ID, name, and address. We can use the INDEX and MATCH functions to look up a customer's address based on their ID.
5. Using VLOOKUP and HLOOKUP Functions
The VLOOKUP and HLOOKUP functions are two of the most commonly used functions in Excel. The VLOOKUP function looks up a value in a table and returns a value from another column, while the HLOOKUP function looks up a value in a table and returns a value from another row.
For example, suppose we have a dataset that contains customer information, including the customer ID, name, and address. We can use the VLOOKUP function to look up a customer's address based on their ID.
6. Using Power Query
Power Query is a powerful tool in Excel that allows you to connect to external data sources, such as databases and web pages, and import data into Excel. Power Query also provides a wide range of data manipulation tools, including data cleaning and transformation.
For example, suppose we have a dataset that contains customer information, including the customer ID, name, and address. We can use Power Query to import the data into Excel and perform data manipulation tasks, such as cleaning and transforming the data.
7. Using Macros
Macros are a powerful tool in Excel that allows you to automate repetitive tasks. A macro is a set of instructions that can be recorded and played back to perform a specific task. Macros can be used to perform complex data manipulation tasks, such as data cleaning and transformation.
For example, suppose we have a dataset that contains customer information, including the customer ID, name, and address. We can use a macro to automate the process of cleaning and transforming the data.

Gallery of Data Manipulation in Excel


FAQs
What is data manipulation in Excel?
+Data manipulation in Excel refers to the process of cleaning, transforming, and preparing data for analysis.
What are some common data manipulation tasks in Excel?
+Some common data manipulation tasks in Excel include data cleaning, data transformation, and data summarization.
What is the VLOOKUP function in Excel?
+The VLOOKUP function in Excel looks up a value in a table and returns a value from another column.
By following these seven ways to master data manipulation in Excel, you can unlock the full potential of Excel and take your data analysis skills to the next level. Whether you are a beginner or an advanced user, these techniques will help you to manipulate data with ease and perform complex data analysis tasks with confidence.