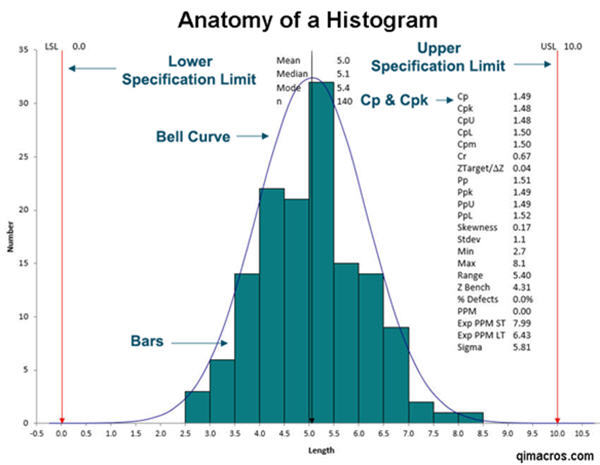
The concept of process capability and the use of Cpk (Centering Capability Index) to measure it can be complex and daunting, especially for those without a strong statistical background. However, with the help of Excel, calculating Cpk can be made significantly easier. In this article, we will delve into the world of process capability, explain what Cpk is, and provide a step-by-step guide on how to calculate it using Excel.

Understanding Process Capability and Cpk
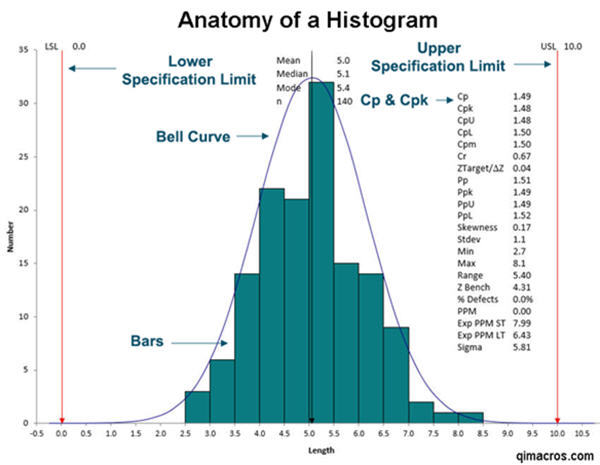
Process capability is a measure of how well a process can produce output within specified limits. It is crucial in manufacturing and quality control to ensure that products meet customer requirements and specifications. Cpk is one of the metrics used to measure process capability. It takes into account the centering of the process and the spread of the data, providing a comprehensive view of the process's ability to produce output within the specified limits.
What is Cpk?
Cpk, or Centering Capability Index, is a statistical measure that compares the width of the specification limits to the width of the process's natural variation. It is a ratio that indicates how well a process is centered within the specification limits. A higher Cpk value indicates a more capable process.
Calculating Cpk in Excel
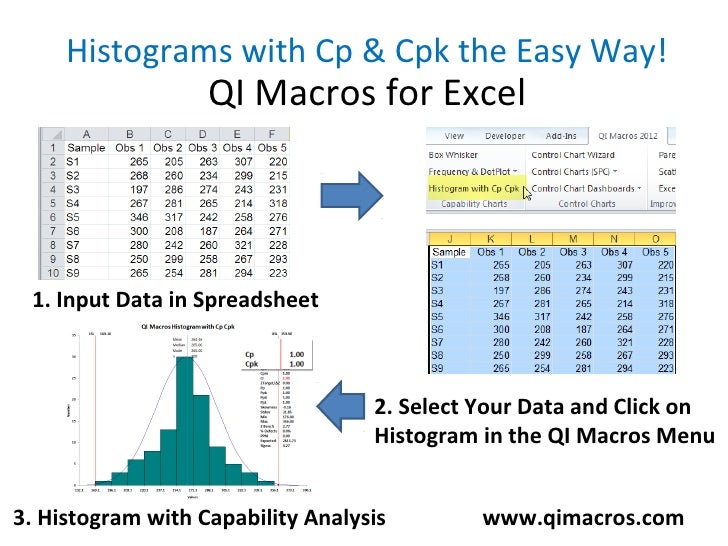
Calculating Cpk in Excel involves several steps, from preparing your data to using formulas to compute the Cpk value. Here's a step-by-step guide:
-
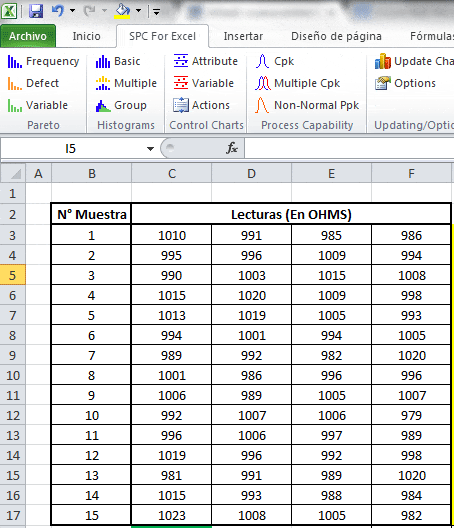
Prepare Your Data: Start by organizing your data in a column in Excel. Ensure that your data represents a continuous process and that the specification limits are known.
-
Calculate the Mean: Calculate the mean of your data set. This represents the center of your process.
=AVERAGE(range)Where
rangeis the range of cells containing your data. -
Calculate the Standard Deviation: The standard deviation represents the spread of your data. Excel provides two formulas for calculating the standard deviation:
STDEV.Sfor sample standard deviation andSTDEV.Pfor population standard deviation. Choose the appropriate formula based on whether your data represents a sample or the entire population.=STDEV.S(range) or =STDEV.P(range)Where
rangeis the range of cells containing your data. -
Determine the Specification Limits: Identify the upper and lower specification limits (USL and LSL) for your process. These are usually provided by the customer or regulatory requirements.
-
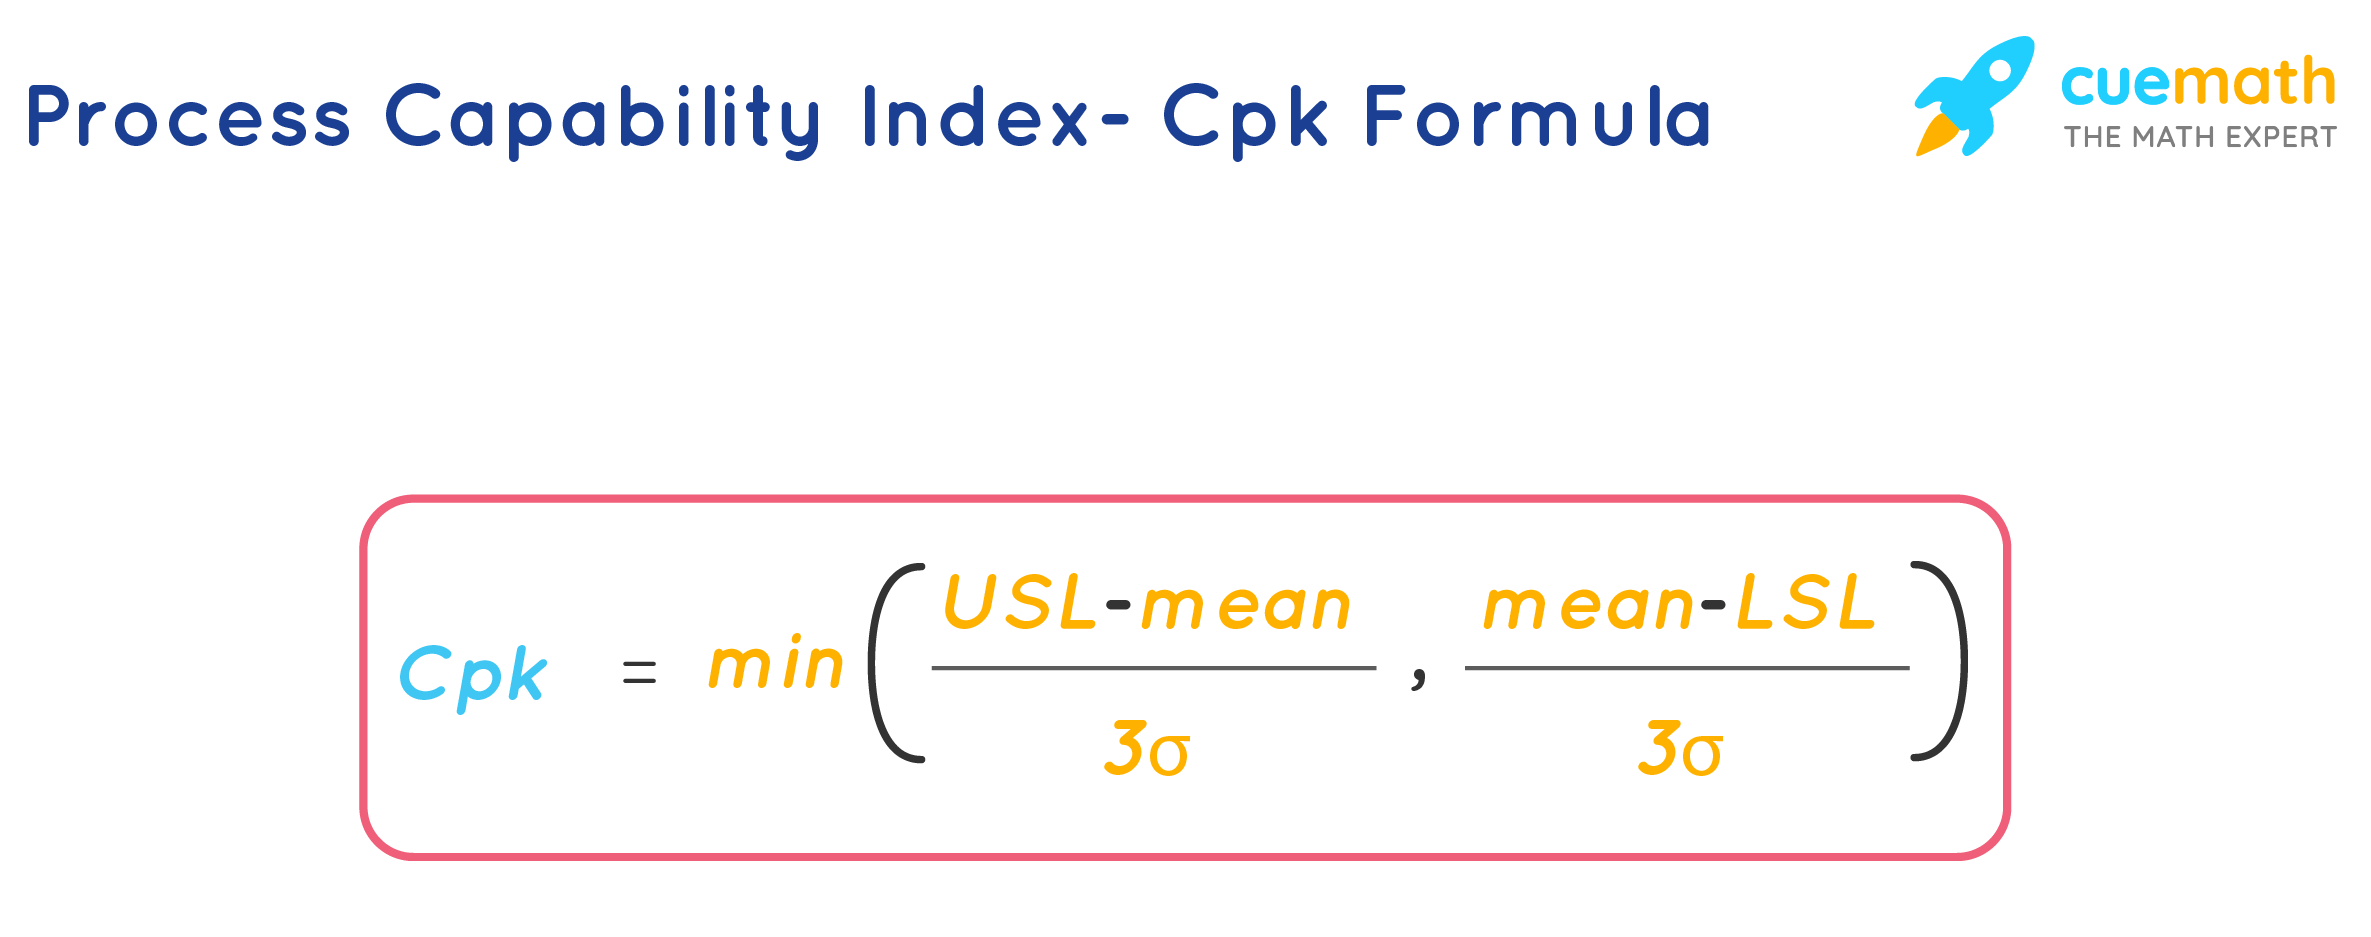
Calculate Cpk: Use the following formula to calculate Cpk, where
meanis the average of your data,std_devis the standard deviation,USLis the upper specification limit, andLSLis the lower specification limit.=MIN((USL-mean)/(3*std_dev),(mean-LSL)/(3*std_dev))This formula calculates both the Cpk for the upper and lower specification limits and returns the minimum value, which is the Cpk value for your process.
Interpreting Cpk Values
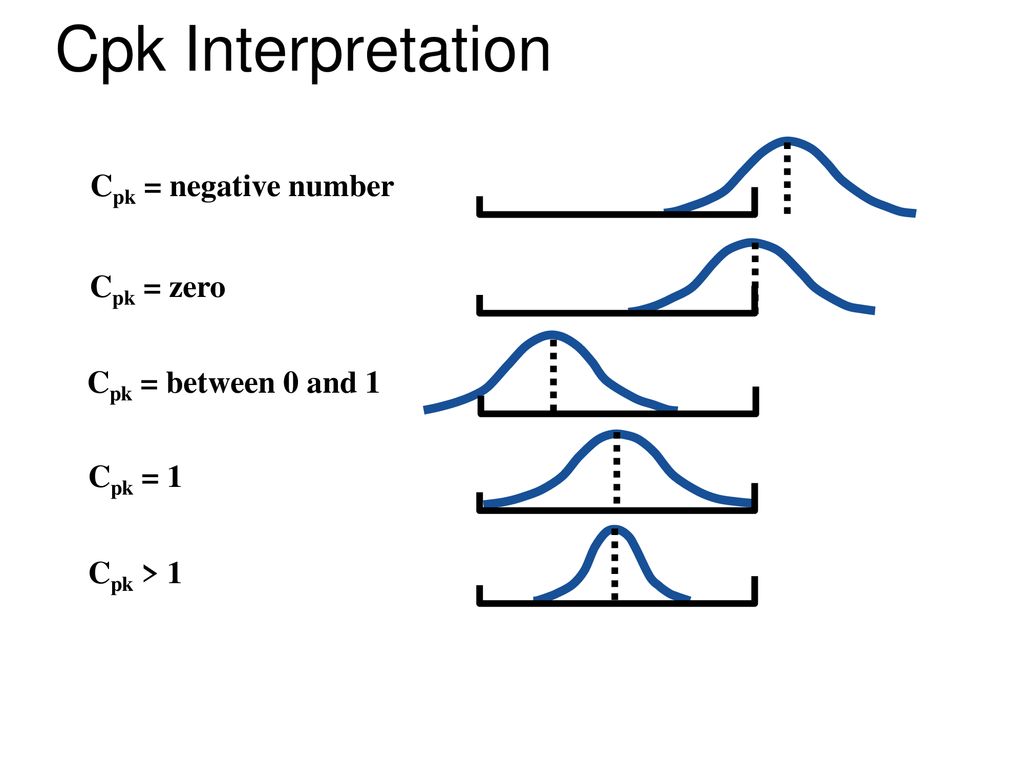
- A Cpk value greater than 1 indicates that the process is capable of producing output within the specification limits.
- A Cpk value less than 1 indicates that the process is not capable of producing output within the specification limits.
- A Cpk value of 1 or higher is generally considered good for most applications.

Conclusion
Calculating Cpk in Excel may seem daunting at first, but by following these steps, you can easily determine the capability of your process. Understanding process capability and using metrics like Cpk can significantly improve the quality of your products and customer satisfaction. Whether you're in manufacturing, quality control, or any field where process control is crucial, mastering the calculation of Cpk in Excel can be a valuable skill.


What is the significance of Cpk in process capability?
+Cpk, or Centering Capability Index, measures how well a process is centered within the specification limits and how well the process's natural variation fits within those limits.
How do I calculate Cpk in Excel?
+To calculate Cpk in Excel, you first need to calculate the mean and standard deviation of your data. Then, use the formula =MIN((USL-mean)/(3*std_dev),(mean-LSL)/(3*std_dev)) to compute the Cpk value.
What does a Cpk value greater than 1 indicate?
+A Cpk value greater than 1 indicates that the process is capable of producing output within the specification limits, meaning the process is centered and its natural variation fits well within the limits.
